Described below are 3 kinds of graphic forecasts available in Sirius:
- Time Line Format
- AstroSignature, Forecast Graph and Electional Forecast Graph
- Graphic Ephemeris
You can click on the images below to see a larger version of the image.
Time Line Format
Time Line Format
An increasing number of astrologers now use the Time Line format as their primary tool for forecasting. The Time Line allows you to quickly and easily see what aspects are in effect at a given time. The AstroSignature Forecast Graph and Electional Forecast Graph are breakthrough tools for the practicing astrologer, researcher, and anyone who simply wants to know when somebody is likely to have opportunities in business. The graphic ephemeris is a wonderful way to see the movement of planets and to see when transiting or progressed planets aspect each other or aspect planets in a natal chart.
Selecting the Time Line Format
Select forecast methods
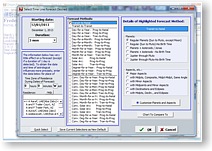
Select forecast methods

To select the Time Line Format, simply click the Forecast Icon and select "Time Line Format" in the popup menu.
Then a window is displayed which allows you to easily select which forecast methods you wish to include, such as transit-to-natal, secondary (Day-for-a-Year) progressed-to-natal, etc. as well as the planets and aspects desired. The Customize Planets and Aspects button provides the ability to customize the selections. Click the image to the right for a better view of this window.
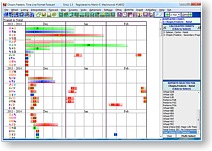
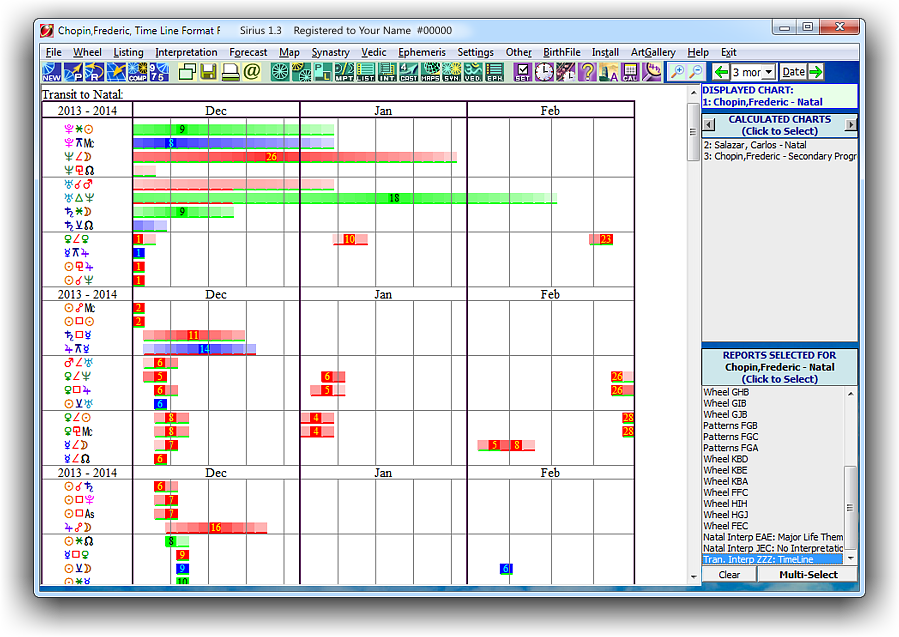
Time Line
Time Line
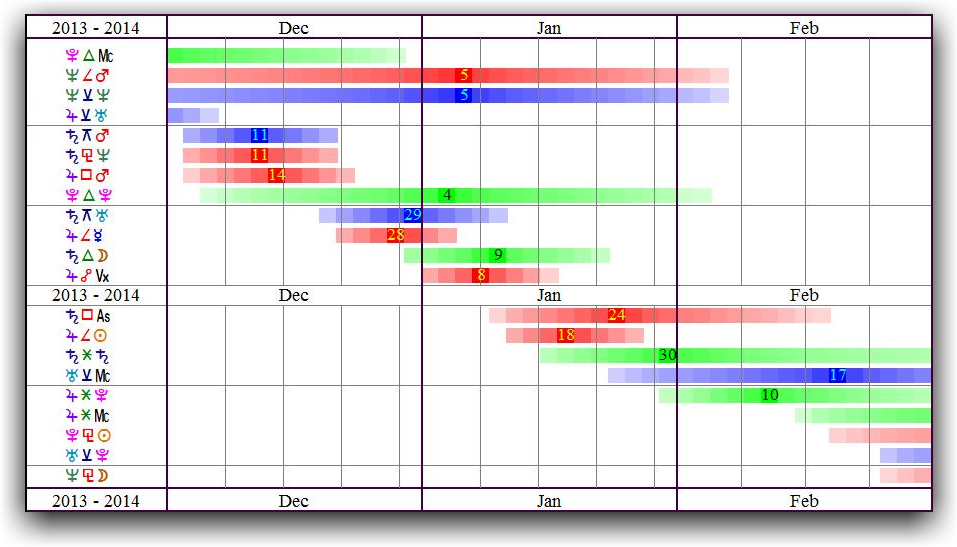
The time line is beautiful. If you click the image shown to the right you can quickly see (if you are familiar with astrological symbols) that transiting Saturn is quincunx natal Mars and transiting Saturn is sesquiquadrat natal Neptune on December 11, and transiting Jupiter is squar natal Mars on December 14. The really wonderful feature of a Time Line is that you can also see that the transiting Neptune semisquare natal Mars and transiting Neptune semisextile natal Neptune aspects are within orb as well. These two aspects are applying and are exact on January 5. Transiting Pluto is trine natal MC and is separating. All of this information is visually presented and the gradual change in intensity of color helps to intuitively sense how the impact of the aspect increases and decreases in strength in the person's life.
Flexibility: Options of the Time Line Format
The flexibility and power of the Time Line forecast is amazing. You can include the zodiac sign and house of the transiting, progressed, and natal planets, you can include midpoint structures, planetary pictures (also known as isosceles trapezoids or isotraps), parallels of declination. There are advanced features like including a list of aspects in the natal chart that involve the same planets by transit or progression or are related by ruling signs that the planets are in (an idea promoted by astrologers C.E.O. Carter and Robert Blaschke). To learn more about how to select and use these features, you can watch the video Sirius Astrology Software: Prediction with Transits.
For even more information about the Time Line forecast feature in Sirius you can watch the video Sirius Astrology Software: Advanced Prediction Methods with Transits and Progressions. This video on advanced features describes the use of midpoints and phase angles and forecasting. If you are not interested in these advanced features, then there is no problem. Simply don't select them. Sirius is designed so that people who just want the basics can easily use the program without being distracted by a lot of information that is not needed, and people who use less common techniques can easily obtain the information that they need as well.
AstroSignature Forecast Graph and Electional Forecast Graph
The AstroSignature Forecast Graph and Electional Forecast Graph are breakthrough tools for the practicing astrologer, researcher, and anyone who simply wants to know when somebody is likely to have opportunities in business, perform well on tests, be physically sensitive, be in the mood to take take away from the usual routine for rest and relaxation, and other areas of interest. These features provide all of the astrological details for the astrologer and a self-explanatory graph for the astrologer as well as for clients and customers of a professional astrologer, or anyone else that you run the forecast for. You can customize the astrological formula that is used and you can create your own categories.
AstroSignature
AstroSignature
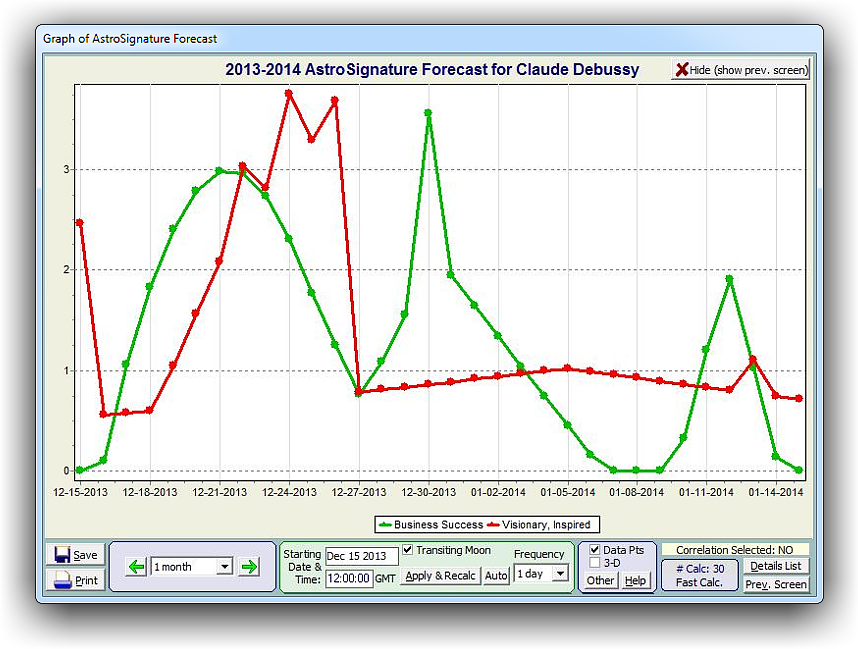
You can click on the image on the right to see an example of an AstroSignature Forecast for "Business Success" and for "Visionary, Inspired" for one month. It is easy to see when business success and feeling visionary and inspired are higher and lower during this month. Of course you want to know what astrological influences are causing the graph to go up and down, and this information is available in another window. You can click on the image to the right to see an example of this listing. The listing shows every astrological influence that contributed to each score on each day.
AstroSignature
AstroSignature
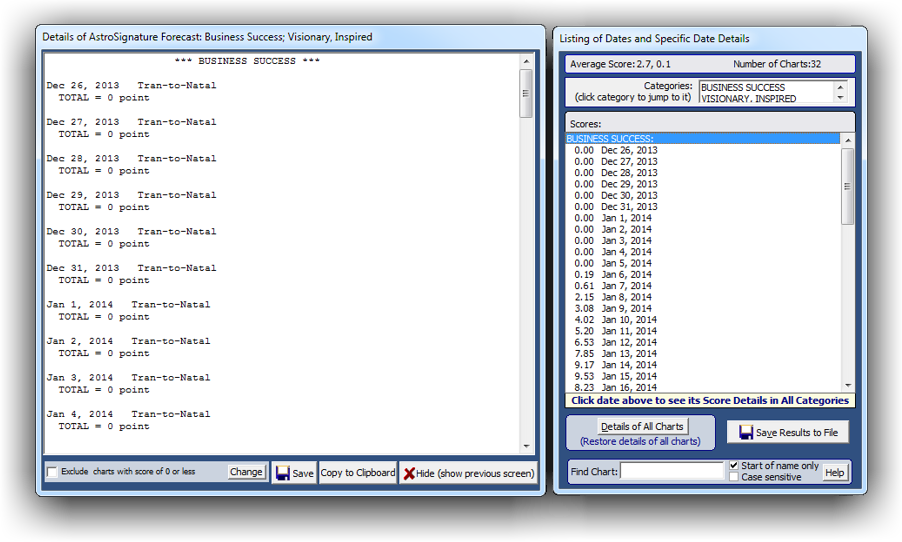
There is also a listing of categories; in this example there are two categories: BUSINESS SUCCESS and VISIONARY, INSPIRED. You can click on the category to jump to the scores for that category and you can click on a date in the short listing on the right to jump to the score details for that date. This ability to jump to a specific category and date helps you obtain the information you are interested in rather than scrolling through the entire list of astrological details in the larger window shown on the left. All of these subtle refinements to the program help you work quickly and smoothly with your clients or research.
One Day Details
If you wish to zoom into a specific day and see how the graph and astrological influences change throughout the day, you can include Moon aspects, Moon sign, planets in houses, the rising sign, etc. These are astrological influences that move too quickly for long-term forecasting but are important for changes throughout the day. Because the placement of house cusps depends on location, there is a place for you to enter the location when a one-day AstroSignature Graph is selected. Very conveniently, observance of Daylight Saving Time is determined and changed during the dates selected so that clock times are accurate. Click on the "AstroSignature Forecast Graph" video image to the right for examples of how the AstroSignature Forecast Graph is used for real-world situations. In this video we show how performance of two political candidates for President of the United States was predicted using the AstroSignature Forecast Graph. Towards the end of this video we see an example of an AstroSignature Forecast Graph for one day is given.
Electional Forecast
Picking dates for something is often referred to as electional astrology. For example, you may wish to pick a date for a wedding, signing a business deal, etc. In electional astrology the transiting positions in the sky unrelated to any particular chart, or what is often referred to by astrologers as transit-to-transit aspects are used. You may also wish to include transit-to-natal or even progressed-to-natal or progressed-to-progressed aspects. When you select the Electional Astrology Graph in Sirius transit-to-transit aspects are selected. You can also check the options for transit-to-natal and other methods as well if you wish to.
Medieval (Classical) Astrology Forecasts
There are AstroSignatures in Sirius that pick times during the day when a particular planet or house is strong. These AstroSignature forecasts are based on classical astrological influences like essential dignities, planetary hours, planets conjunct fixed stars, rising sign, and aspects to the ruler of a house cusp. There is also a Talisman images option of Sirius that can be used in conjunction with the AstroSignature forecasts for strength of a planet through the day, which is helpful for those who would like to have the talismanic images for use with these forecasts. The images are based on the very important book the Picatrix, and the AstroSignature used is based on ideas presented in the Picatrix and other classical works. For more information on the classical astrology forecast features available in the AstroSignature Forecast Graph you can watch the video "Electional Astrology Graph, Classical Astrology, and the Picatrix".
Testing Astrological Ideas and Developing Better Astrological Methods
Because the AstroSignature Forecast Graph allows you to so easily see when a particular area of life is emphasized, it is a wonderful tool for testing ideas as well as simply seeing when a particular area of life is emphasized. For example, one of the AstroSignatures provided in Sirius is Accident Proneness. Can this AstroSignature really forecast when we are likely to be accident prone? It is based on ideas that many astrologers agree with, such as transiting Mars square natal Uranus and transiting Uranus square natal Mars inclining to accidents. But does it really work? Several users of Sirius have reported moderately successful results with it and we decided to test a new AstroSignature for forecasting accident proneness based on particular midpoint structures. This alternative formula appears to work very well! Recently in an astrology class with about 20 students, many of the students compared the graph with dates on which they had an accident or someone that they know had an accident and a recorded time of birth is available and the date of the accident is known. The results confirm what we discovered several years ago on the dates of a tragic and fatal event in the life of two celebrities. You can watch the tutorial "Predicting Accidents with Midpoints" for more information about this formula and how the AstroSignature Forecast Graph feature of Sirius is used to make these forecasts. Starting with Sirius 2.0 the Accident Proneness with Midpoints AstroSignature is included in the program.
Financial Astrology and Quantitative Research in Astrology
An amazingly powerful feature of the AstroSignature Forcast Graph and the Electional Astrology Graph is that you can plot actual performance data such as stock prices and the predicted data on the same graph and a value of how well the forecast predicts this data is provided for you! The most typical "performance data" is financial data such as stock prices or commodity prices but any measurable phenomenon such as temperature, rainfall, or batting performance of baseball players can be used. In the Sirius software some stock and commodity data is provided. Frankly, this is a feature that is so progressive, sophisticated, and elegant that it sounds rather futuristic but is actually available now. This is not a feature that most astrologers are likely to use because most astrologers and students of astrology are likely to use because most people are interested in information about their own lives and lives of other people rather than predict the price of a stock, but for those people interested in predicting something measurable, this feature is wonderful.
There are two tutorial videos that explain how these features are used. The video How to Import Data and Select Peak Dates describes how you import financial data into Sirius and how you can graph the financial data and extract peak dates and import them into the database of charts in Sirius. These peak dates can be studied with the research tools in Sirius to determine what astrological influences correlate with high prices. This video provides important information for financial astrologers. However, if you are not a financial astrologer or you simply wish to jump right into the heart of how the financial astrology features in Sirius work, you may wish to first watch the video Financial Astrology: How to Forecast Stock and Commodity Prices because this video describes the essential features for financial forecasting with the AstroSignature Forecast Graph and the video Forecast Stock.
These financial research features have been used to develop the Dow Jones Industrial Forecast option and the Gold Price forecast options. Astrologers have also written papers on financial astrology based on research conducted using these forecasting features in Sirius.
Graphic Ephemeris and Text Ephemeris
Graphic Ephemeris
The graphic ephemeris is a wonderful way to see the movement of planets and to see when transiting or progressed planets aspect each other or aspect planets in a natal chart. The graphic ephemeris was popularized and is widely used by astrologers who use midpoints. In the cosmobiology school of astrology developed by astrologer Reinhold Ebertin the graphic ephemeris is very popular. However, a graphic ephemeris can be very helpful to astrologers who use almost any astrological methods.
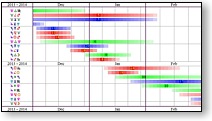
Graphic Ephemeris
Graphic Ephemeris
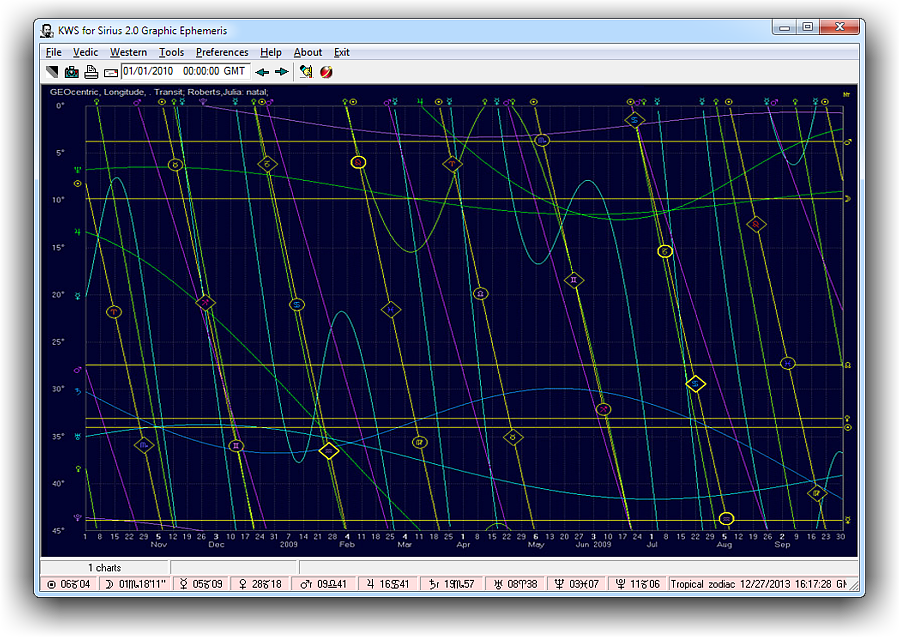
The Graphic Ephemeris feature in Sirius is very flexible. You can include asteroids and you can place transits, progressed chart, and natal chart planets all in one graph. You can select heliocentric or geocentric and also declination or latitude, as well as many other options. The tutorial "The Graphic Ephemeris" demonstrates the use of the Graphic Ephemeris and many of the options that are available. Shown below are four examples of the Graphic Ephemeris.
Text Ephemeris
Text Ephemeris
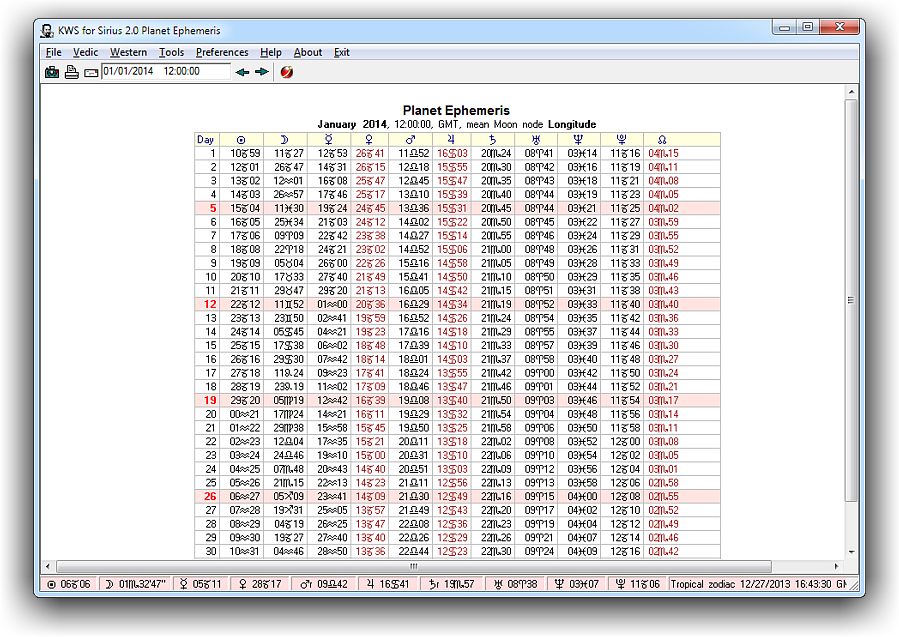
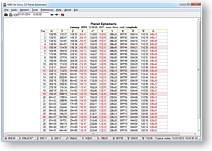
Although the text ephemeris is not a graphic, we describe it here because it complements the graphic ephemeris. Some astrologers prefer a text ephemeris rather than a graphic ephemeris. Of course many astrologers use both a graphic ephemeris and a text ephemeris but for those of you who are not interested in the graphic ephemeris but do use a text ephemeris, rest assured that a text ephemeris is also available.
Text Ephemeris
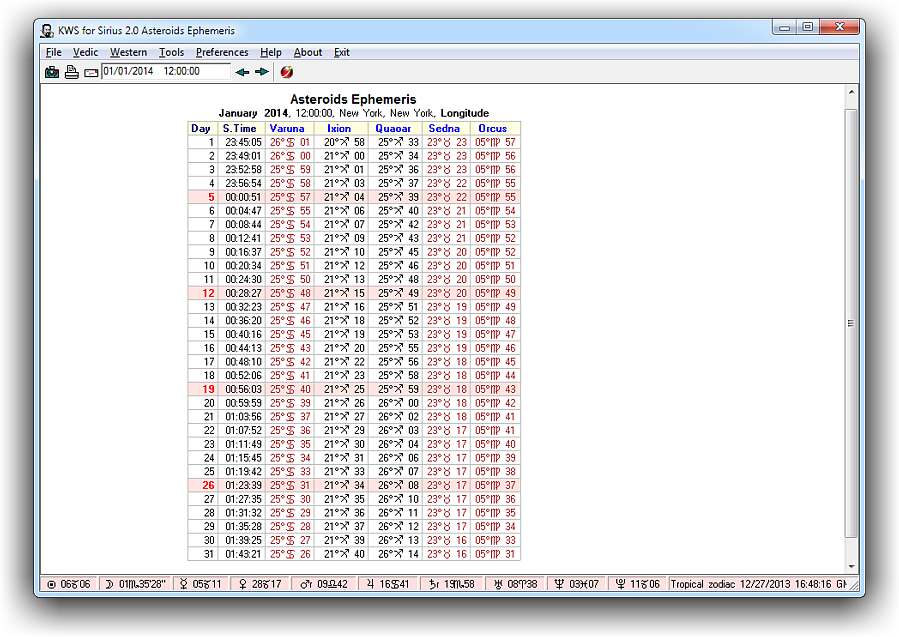
The Text Ephemeris feature is very powerful. You can produce an ephemeris for an asteroid, view monthly or yearly positions, change the time of day for the ephemeris, etc. Many astrologers still purchase an ephemeris book but with the Text Ephemeris feature that is built into Sirius, many of these astrologers are realizing that they no longer need the book and it is easier and faster to browse through the Text Ephemeris feature in Sirius than to browse through a physical book.
Asteroids Ephemeris
Asteroids Ephemeris
Classical Electional Forecast New in Version 4.0
with Talisman Images
Select from Art Gallery or from the Electional Graph and then select “Classical Electional: Planets” The resulting 28 talisman images convey the power and strength of the original descriptions given in the Picatrix! the Picatrix is an ancient book which describes 4 different images for each of the 7 traditional planets. Note that we refer to the Sun and Moon as planets, but obviously they are not planets. Each column of pictures shown below is the image of a different planet; the first column is the Sun, followed by the Moon, Mercury, Venus, Mars, Jupiter, and Saturn. Each of the 4 rows of images is the 4 different images in described in the Picatrix for a planet.
 Windows 10 / 11 compatible!