
|
A REASSESSMENT OF THE MARS EFFECT & OTHER PLANETARY EFFECTS Copyright © 2010 All Rights Reserved by David Cochrane and David Fink, Ed.D. Abstract:Michel Gauquelin's highly controversial and disputed claim that eminent professionals are more likely to be born when planets occupy particular areas in the sky in their diurnal cycle has to date not been successfully replicated according to some skeptical reviewers of his research. As a first step in reassessing the validity of Gauquelin's theory, the diurnal distribution of Mars, Jupiter, and Saturn in the data collected by Gauquelin is reanalyzed using software that was unavailable at the time that the Gauquelin studies were conducted. The results of this reanalysis of the data suggest that the "plus zones" appear to be much smaller than the plus zones suggested by Gauquelin. The theory of golden means proposed by Theodor Landscheidt as a basis for the planetary effects by Gauquelin is mildly supported by the data. Measurement in Placidan arc sectors provided more significant results than measurement in zodiac longitude or right ascension. For future research involving hypothesis tests it is suggested that smaller plus zone areas than specified by Gauquelin be specified in the hypothesis test. Keywords: Astrology — Gauquelin — Mars Effect — Landscheidt — golden ratio Introduction:Planets rise in the east, culminate (reach their highest point in the sky above the horizon), set in the west, anti-culminate (reach their lowest point in the sky below the horizon), and then rise again in a cycle that on average is about 24 hours in length. As with the Sun, the time from rising to setting varies considerably depending on the geographic latitude and also the declination (angular distance from the celestial equator) of the planet. Because traditional astrological associations with the planet Mars include qualities like aggression and physical prowess, and because planets traditionally were considered "strong" in a person's life if located near the rising or culminating positions at birth, Michel Gauquelin proposed that an eminent athlete is more likely to be born at that time of the day just after Mars rises and culminates. In some of Gauquelin's studies he divided the sky into 12 sections and in other studies he divided the sky into 36 sectors. When a planet rises, it enters the first sector regardless of whether there 12 or 36 sectors. If 12 sectors are used, then the planet enters the fourth sector when it culminates, enters the seventh sector when it sets and enters the tenth sector when it anti-culminates. Each of the quadrants is divided into 3 sections, which are calculated with a method sometimes referred to as Placidian arcs or declinational circles, and a planet occupies each of the three sectors in each quadrant for approximately the same duration of time. Gauquelin proposed that sectors 1 and 4 (just after rising and culminating) are the areas in the planet's diurnal motion when its effect is most strongly felt. Eminent athletes, for example, are more likely to be born when Mars is in sectors 1 and 4. According to astrological lore, Mars is the planet of action and power, so an association of outstanding athletic performance with the planetary position of Mars is similar to astrological ideas, although astrologers generally do not measure planetary positions using Placidian arcs nor do they usually associate the areas just after rising and culminating as areas where a planet is strong. Therefore, Gauquelin's theory of sensitive diurnal sectors has some affinities with traditional astrological theory but also departs from astrological tradition in some ways as well. When 36 sectors are used, sector 1 in the 12-sector division becomes sectors 1 to 3, and sector 4 in the 12-sector division becomes sectors 10 to 12. The sector just preceding these sectors, 36, and 9, were also regarded by Gauquelin in his later studies as being important. (Gauquelin, 1988). Gauquelin proposed that eminence in various professional fields is associated with different planets in "plus zones" as shown in Table 1. In this table "+" indicates that the planet is likely to be in sectors 1 and 4, and to a lesser extent the opposite sectors of 7 and 10, in the 12-sector division of the diurnal cycle. Similarly, "-" indicates that the planet is less likely to be in one of these sectors for this professional group. For example, according to Gauquelin, scientists are more likely to have Saturn and less likely to have Jupiter in one of these sectors than people in a different profession. Note that more specifically Gauquelin proposed that the tendency for these planet placements occurs only in eminent scientists, that is, scientists who have achieved eminence or prominence in their field.  The data presented in Table 1 present a simple and elegant astrological theory. Each profession has its own unique "astrological signature". An actor is more likely to have the planet Jupiter in a "plus zone" as Gauquelin referred to sectors 1 and 4 of the 12-sector division of the diurnal sky. For sports champions the planet is Mars, for military leaders both planets Mars and Jupiter, and so on. Also, the planets correspond well with the attributes of planets traditionally associated with the behaviors involved in these professions. For example, the planet Jupiter is expansive, optimistic, and gregarious according to astrologers and is associated with professions that involve expressiveness or grandeur: actors, military leaders, and notable politicians. Saturn is a planet associated astrologically with introversion, focus, and severity, and scientists have a combined effect of Jupiter excluded from a plus zone and Saturn in a plus zone which hypothetically increases the focused attention required of scientists. The Moon is associated with moods and establishing a bond with the public through a public sentiment and mood, a helpful quality for politicians. Venus, which in myth and astrological symbolism is a planet of beauty and grace, appears more often in plus zones for painters. The simplicity of Gauquelin's theory and the close correspondence of appropriate planets with professions from the point of view of astrological tradition are attractive features for believers in astrology, and is disconcerting for skeptics of astrology if his findings can be replicated in later studies. Gauquelin's findings became a source of controversy and seemingly endless debate, and many non-believers have concluded that there are methodological problems with Gauquelin's studies. (Dean, 2002; Dean, 2003, Nienhuys, 1997). Reanalysis of the Gauquelin Data:Gauquelin analyzed the Mars sectors in the birth charts of 2,088 eminent sports champions (Gauquelin, 1988). He also analyzed the Mars sectors in the charts of 24,961 charts of a control group and he presents a Chi Square statistical test that compares the frequency of the occurrence of Mars in sectors 1 (just after rising) and 4 (just after culminating) of the12-sector division of the diurnal circle between sports champions and the control group. The statistical significance of the Chi Square test is pp<.001. (Gauquelin, 1988, page 37). The simplicity of the hypothesis (Mars occurs more often in diurnal sectors 1 and 4 in eminent sports champions than in other charts) and the high degree of statistical significance suggests that Gauquelin had made a breakthrough discovery. However, a visual inspection of the distribution of planetary position in diurnal sectors reveals a more complex distribution of Mars in the diurnal sectors than one may have suspected from reading the research reports of Gauquelin. In Figure 1 is a graph of the planet Mars in 12 sectors and 72 sectors for sports champions. The 72 sector division shows variations in frequencies across 6 "sub-sectors" of each of the 12 sectors that Gauquelin analyzed in his study. The data were obtained from two different sources: astrologer Lee Lehman who had obtained the data directly from Francoise Gauquelin (the wife of Michel Gauquelin and a co-researcher with Michel Gauquelin) and also available from the website www.cura.fr The data from Lee Lehman and the website were compared and found to be virtually identical. These data are also provided in commercial software (Cosmic Patterns, 2009). There are 2,536 sports champions in this analysis as compared to 2,088 sports champions in the study conducted by Gauquelin cited above in 1988. The continued work by the Gauquelins added over 400 additional sports champions, an increase of 21%, to the data collection since the study in 1988. 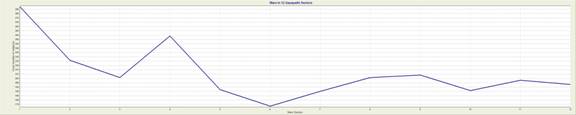 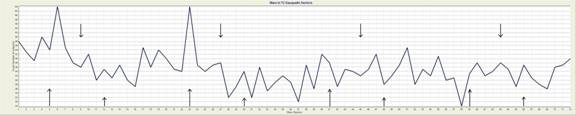 In this paper we often refer to each of the sectors analyzed by Gauquelin as "Placidian arc sectors" to distinguish them from other ways of measuring diurnal sectors which are discussed later in this paper. The 12-sector graph in Figure 1 shows the peaks in sectors 1 and 4 as expected according to Gauquelin's theory. The 12-sector graph in Figure 1 is extremely similar to the 12-sector graph of Mars for sports champions in the original Gauquelin research (Ertel and Irving, 1996, page KI-7). The relative heights of each sector are nearly identical to those obtained by Gauquelin. Slight differences between the graph produced by Gauquelin and the graph given in Figure 1 are line graph is slightly higher at sectors 8 and 11 in Figure 1 than in the graph given by Gauquelin. Given that there are 21% more sports champions in the new analysis, the overall striking similarity in graphs indicates that the additional sports champions did not alter the basic distribution of Mars in Placidian arc sectors found in Gauquelin's original study and that the calculation of planets in Placidian arc sectors in this study agrees with the calculation method used by Gauquelin. The 72-sector graph indicates that the distribution of Mars in sectors 1 and 4 of the 12-sector analysis is not equally distributed in these "plus zones". By dividing the 360 degrees of the diurnal path of Mars in 72 sectors of 5 degrees for 2,536 champions an average of about 35 sports champions per sector is obtained. If, for example, 180 sectors of 3 degrees is used, an average of about 14 sports champions per sector is obtained and consequently there would be much more random fluctuation in scores due to the small average number of 14 subjects per sector. The choice of 72 sectors was chosen to give a more detailed view of the distribution of Mars but without having too much random fluctuation in scores due to the smaller average number of data for each sector. The 72-sector graph in Figure 1 shows that there are rather narrow and sharp peaks that account for the peaks in the 12-sector graph. Rather than a relatively high occurrence of Mars equally though the first and fourth sectors of the 12-sector graph, the 72-sector graph reveals sharp peaks occur towards the end of these sectors. The first peak in the 72-sector graph is actually closer to the second sector in the 12-sector graph! However, the graph drops quickly after this peak and consequently the total number of subjects is greater in sector 1 rather than sector 2 in the 12-sector graph. Interestingly, a similar phenomenon occurs in sector 4 of the 12-sector graph. The actual peak shown in the 72-sector graph is between sectors 4 and 5 in the 12-sector graph, and, similar to the first peak, the decline after the peak is steep. The overall pattern of these two peaks is extremely similar: two small peaks precede them followed by a steep decline. In this paper we will not analyze all of these similarities in the peaks; we will focus simply on the fact that the detailed distribution of planets in the 72-sector graphs suggests that the actual "plus zones" are slightly more complex and narrower than the plus zones proposed by Gauquelin. Rather than visualizing the plus zone as a span of about 1/12 of the circle just above the eastern horizon and 1/12 of a circle just upper culmination, the 72-sector graph in Figure 1 suggests a peaking late in these sectors followed by a sharp decline. The observation of variation in the Gauquelin sectors was noted by Theodor Landscheidt (Landscheidt, 1989). Landscheidt proposed that the peaks occur at golden ratio points along the diurnal path of a planet. The golden ratio is significant in many biological processes and has highly interesting mathematical properties (Livio, 2003). A mechanism by which the golden ratio or any other astrological variable could be significant has not yet been clearly formulated but nevertheless Landscheidt is extrapolating a concept that is useful in other areas of science to the domain of astrology. If this extrapolation is validated by future research, a mechanism by which it may operate can be pursued. As stated earlier, the lack of supporting scientific literature and the lack of an agreed upon mechanism by which astrological influences operate suggest that any astrological hypothesis be met with skepticism, and rigorous and careful testing of the hypothesis is required. In this initial attempt to verify the theories of Gauquelin and Landscheidt, we do confirm the observation of Landscheidt that the distribution of Mars in plus zones may correspond to golden ratio points, as described below. The information provided below was determined by carefully analyzing the information give by Landscheidt, and is arguably a more detailed and systematic in presentation than the one given by Landscheidt. The golden ratio is approximately 0.618, which is equivalent to approximately 222.5 degrees of the 360 degrees of a circle. Because Gauquelin used rising, culminating, setting, and anti-culminating points and these points are clearly defined astronomically, we can measure an angle of 222.5 degrees from any of these four points. However, the setting point is opposite the rising point and we will refer to two points that are opposite each other as an axis. Similarly the culminating and anti-culminating points lie on an axis. Furthermore we can measure in either a clockwise or counter-clockwise direction. The following angular distances therefore are golden mean points in relationship to the rising-setting axis measured in a clockwise direction, which is the direction in which planets travel in their diurnal motion and is also the order in which Gauquelin ordered sectors: 225.5 (.618 x 360), 137.5 (.328 x 360), 42.5 (.618 x 360 + 180), and 317.5 (.328 x 360 + 180). The addition of 180 is the measurement from the setting point. Note that 42.5 and 225.5 lie on an axis as do 137.5 and 317.5. Therefore there are two golden mean axes from the rising point and setting point: 42.5 degrees and 137.5 degrees. The 42.5 degree axis consists of the golden ratio points based on the golden ratio of .618 and 137.5 is based on the "minor" golden ratio of .328. Landscheidt also hypothesized that the golden ratio point from rising to setting, setting to rising, culminating to anti-culminating, or anti-culminating to culminating could also be important. To make this idea concrete, imagine that for some reason the power or influence of the Sun in some way reaches its maximum (or minimum) when it reaches the golden ratio point in its travel from rising to setting. Maximum (or minimum) points also occur measured from setting to rising, culminating to anti-culminating, and anti-culminating to culminating. These golden ratio points are in addition to the 42.5 degree and 137.5 ratio points discussed above, which are golden ratio points in relationship to one complete diurnal cycle. These additional golden ratio points measured from the rising point and setting point add two more axes: at 68.8 degrees and 111.2 degrees (and the points opposite to these). The angle of 111.2 degrees can be regarded as more closely related to the golden ratio (180 x .618) and the angle of 68.8 degrees as more closely related to the minor golden ratio (180 x .382). To summarize, there are four golden ratio axes according to Landscheidt and these are:
In addition to the above four axes, Landscheidt proposes that the axes that are 90 degrees to these axes are also significant, resulting in 4 sets of "crosses" rather than axes that are significant. Landscheidt also suggests that golden ratios of 90 degree sections are also important, so that 55.6 degrees (90 * .618) and 34.4 degrees (90*.382) and the other three points forming crosses with these points may also be significant. In Table 2 is a summary of all of the angular distances that may be golden ratio points in the first 90 degrees from a given point according to Landscheidt.  In Table 2 "GR" indicates golden ratio. The number in bold is the value calculated from the description of the golden ratio. For example, 111.2 degrees is the major golden ratio of 180 degrees.. The other angles are multiples of 90 degrees from the calculated value. The symmetrical cross has an angular distance that is equidistant from the starting point on the other half of the circle. For example, 338.8 (in cross #6) degrees is 21.2 degrees from the starting point so it is a symmetrical cross with cross #1, which includes the value 21.2 as one of its four points. All four points in a symmetrical cross are symmetrical (equidistant from the starting point) of a point in the cross it is symmetrical to. There are a total of six golden ratio crosses for a total of 24 golden ratio points. On average, there is a golden ratio point every 15 degrees. With a large number of golden ratio points, one can argue that it is almost certain that one can find some correspondence of peaks in the diurnal placement of Mars in the charts of sports champions with golden ratio points. On the other hand, we do expect that all four points of a cross have a similar effect, and other consistencies in the use of golden ratios (using major rather than minor gold ratios, for example) can be used to help provide a consistent basis for associating golden ratios with peaks in the graph of diurnal planetary positions of particular planets at the time of birth of people who have achieved eminence in a particular profession. For the placement of Mars for sports champions Landscheidt associates GR cross # 3 with lows and GR cross # 1 with highs in the graph. In other words, Landscheidt proposes that eminent sports champions are less likely to be born when Mars is at the 360-degree major golden ratio point, and they are more likely to be born when Mars is at the 180-degree major ratio point. In the 72-sector graph the large up arrows are 180-degree GR points, the small up arrows are 90-degree GR points, and the down arrows are 360-degree major GR points. Therefore, according to Landscheidt's theory, the large up arrows should indicate highs in the graph and the down arrows should indicate lows in the graph. In the first half of the graph in Figure 1, we see that the two peaks do coincide with the 180-degree GR points (indicated by large up arrows in the 72-sector graph in Figure 1). The 360-degree GR points (down arrows in the graph) do not obviously coincide with troughs as Landscheidt suggests that they would. An alternative theory to Landscheidt's is that 180-degree GR points are associated with peaks and 90-degree GR points (small up arrows in the graph) are associated with the troughs. If we imagine a gradual wave with a sinusoidal shape reaching its highest point where the large up arrows occur in this graph, and reaching its lowest point where the small up arrows occur in the graph, it fits the overall distribution of Mars in the first half of the graph fairly well. In both the 72-sector graph and the 12 sector graph in Figure 1 the first half of the line has two clear peaks and the second half of the line is fairly flat. The first half of the line shows how often Mars was above the horizon at the time of birth of the sports champions and the second half represents the placement of Mars below the horizon. Because the graph of Mars below the horizon is fairly flat, an attempt to associate peaks and troughs in the graph with golden ratio points is difficult, and it appears that the placement of Mars below the horizon is fairly random. Also, in some of Gauquelin's studies (e.g. Gauquelin, 1988) only Mars above the horizon was analyzed. Throughout the rest of the paper we will focus primarily on planets above the horizon, i.e. the first half of the graph. Another consideration in analyzing the diurnal position of planets is the method for measuring the planet position in the diurnal cycle. Gauquelin used a method that we are referring to as Placidian arcs. Astrologers typically project planet positions onto the ecliptic plane and the resulting positions are known as ecliptic positions or zodiac longitude positions. Less used by astrologers but more often used by astronomers are positions projected on the equatorial plane and these positions are known as right ascension positions. After producing graphs in longitude and right ascension measured from both the rising point and the culminating point and comparing these to various golden ratio positions, only the zodiac longitude positions appeared to provide a good correspondence with the peaks and troughs in the graph of Mars for sports champions. However, with 24 golden ratio points and the rather subjective evaluation of agreement of these points with peaks and troughs, other conclusions may be possible. Visual tools are vitally important for initial investigations and exploratory research. We are not presenting here the many graphs that were studied that did not appear to show good correspondence with the peaks and troughs in the graph of Mars. Given in Figure 2 is the graph of Mars in zodiac longitude with the same golden ratio points indicated that are in the graph using Placidian arcs Figure 1. Also included in Figure 2 is the graph using Placidian arcs which was already presented in Figure 1, but is included in Figure 2 to assist in visual comparison of measurement using zodiac longitude and Placidian arcs. 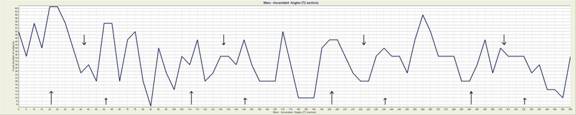  A visual comparison of the zodiac longitude (top) graph and the Placidian arc (bottom) graph appears to show a closer correspondence of highs with up arrows in the zodiac longitude graph. The first 6 of the 8 up arrows in the zodiac longitude graph appear to point to highs, although visual inspection is somewhat subjective. In both graphs the first peak is indicated by the first large up arrow, but in the graph using Placidian arcs the first small up arrow does not point to a peak as clearly as in the zodiac longitude graph. From the above observations we can draw a tentative conclusion that Lanscheidt's theory of golden ratio points provides a better correspondence with highs in the graph than Gauquelin's theory. We also conclude that both zodiac longitude and Placidian arcs may be viable measurement systems. Studying the diurnal distribution of planets in other professions can help confirm whether our tentative conclusions continue to be supported. Rather than relying exclusively on hypothesis testing and quantitative analysis, exploring the data by studying graphs provides insights that can provide a basis for hypotheses that are more likely to be supported in hypothesis tests. According to Gauquelin, military leaders also have Mars (as well as Jupiter) appearing in plus zones more often than can be expected by chance. Given in Figure 3 is the distribution of Mars in Placidian arcs and Zodiac Longitude for military leaders. 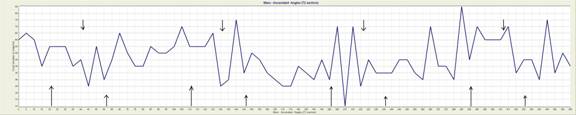 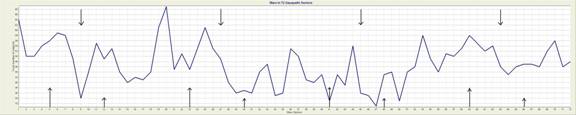 Although there appears to be some relationship of the golden ratio points with peaks and troughs in the graphs in Table 3, the association is not entirely clear and consistent, although the first three arrows (large up arrow, down arrow, and small up arrow) in the Placidian arc graph do line up nicely with the first peak, first trough and second peak. We may be tempted to conclude that the weak support for the "Mars effect" in military leaders is a strong indication that the supposed Mars effect does not exist. However, the expectation that Mars will be prominent in the charts of athletes may be more theoretically sound than the expectation that Mars will be prominent in the charts of military leaders. Although a military leader superficially would seem to be a good symbol of the aggressive nature of Mars, the tendency of modern astrologers is to see planetary effects as being related to basic principles that do not necessarily manifest in obvious ways. In other words, Mars may not be associated with warriors literally but rather with strong motivation and drive. Although military leaders are likely to be more involved with combat and war, it is not as clear that they are more motivated and energetic than professionals in other fields. In Gauquelin's later research he focused on people who were described in their biographies in ways that correspond to the astrological attributes of the planet. For example, a military leader described as energetic and aggressive would be included in the group of military leaders and a military leader not described this way in the biography would be removed from this group. Therefore, Gauquelin was also inclined to reanalyze the data with an interest in personality traits rather than a more superficial association of a profession with the planet. Given this concern, we next look at Saturn in the charts of eminent scientists. Assuming that eminent scientists are more likely to be highly focused, sometimes working quietly, analyzing and studying situations in solitude, the expectation is that scientists are more Saturnian than the average person. We are only speculating here, but also Gauquelin identified the planet Saturn as being in the plus zones for scientists. 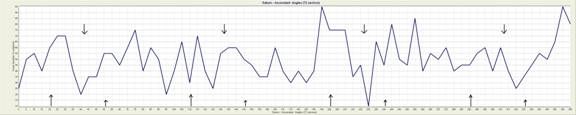 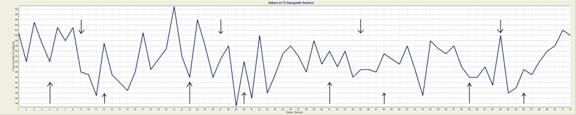 The two graphs for scientists in Figure 4 appear to mildly confirm Landscheidt's theory. In both graphs the first arrow points to a high, the first down arrow points reasonably close to a low, and the second up arrow points to a fairly high point. For the Placidian arcs graph, you can imagine a smooth wave that has a sinusoidal quality reaching a high peak where the large up arrows are and a smaller peak where the low arrows are, the resulting graph appears to have a close similarity to the line graph, especially for the first half of the graph. For our final example of diurnal distribution of planets we will look at Jupiter in the charts of politicians. Gauquelin found that Jupiter appeared in plus zones for politicians. As with Saturn and scientists, the association of Jupiter with politicians would seem to be very appropriate. It seems reasonable to expect that most politicians spend time with situations that involve many people, they deal with large, broad issues, and the travel, dinners, campaigns, and other activities associated with politics involve reaching out, traveling, and dealing more with large concepts more than minute technical details that, for example, a technician would be more likely to be occupied with. In Figure 5 is given the distribution of Jupiter in Placidian arc sectors. The distribution in zodiac longitude is not included because the association with golden ratio points was weak, and we shall focus on Placidian arcs as the most strongly supported measurement system. 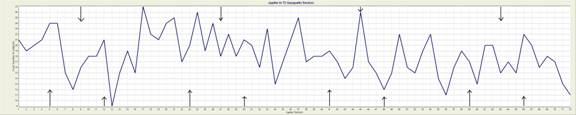 Just as with scientists, the first three arrows (first large up arrow, first down arrow, and first small up arrow) fit very well with the graph. The second down arrow, however, does not point to a low, and in some of the analyses above, the down arrows also do not consistently line up with lows in the graph. Again we find that the up arrows point to highs more consistently in the first half of the graph. Conclusion from the Visual Inspection of the Graphs:From the above graphs the most consistent theme is that the first four or five of the large up arrows (180-degree major GR points) indicate highs, and the small up arrows (90-degree major GR points) also indicate highs but highs that are not as pronounced as for the 180-degree major GR points. Placidian arcs appear work as well, or better, than using either zodiac longitude or right ascension. From the visual inspection of these graphs we conclude a modification to the definition of plus zones as defined by Gauquelin to plus zones that conform more closely to those specified by Landscheidt is likely to produce results in studies with greater statistical significance than using the plus zones as defined by Gauquelin. The visual inspection of graphs focused on the planets Mars, Jupiter, and Saturn and future research can analyze the distribution of other planets in the diurnal cycle. Conclusions:Summarized below are important conclusions from the research presented in this paper.
Acknowledgement:We are grateful for the guidance and technical suggestions of Dr. Monika Ardelt, Sociology Department, University of Florida. References:Cornelius, Geoffrey. (2003). The Moment of Astrology. Bournemouth, England: The Wessex Astrologer. Cosmic Patterns Software. (2009) Sirius software, Version 1.2. Gainesville, FL: Cosmic Patterns Software Dean, Geoffrey. (1977). Recent Advances in Natal Astrology: A Critical Review 1900-1976. England: The Astrological Association. Dean, Geffrey (2002). Is the Mars effect a social effect? A re-analysis of the Gauquelin data suggests that hitherto baffling planetary effects may be simple social effects in disguise. Skeptical Inquirer, May 2002 v26 i3, pp 33(6) Dean, Geffrey (2003). Response to Ertel. (Follow-up). Skeptical Inquirer, Jan-Feb 2003 v27 i1 pp 59(2) Ertel,Suitbert & Irving, Kenneith. (1996). The Tenacious Mars Effect. Londong: The Urania Trust. Gauquelin, Michel. (1988). Is there a Mars Effect? Journal of Scientific Exploration, Vol 2, No 1, pp 29-51 Landscheidt, Theodor. (1989). Sun-Earth-Man: A Mesh of Cosmic Oscillations. London: Urania Trust Livio, Mario. (2003). The Golden Ratio: The Story of Phi, The World's Most Astonishing Number. New York: Random House Nienhuys, Jan Willem. (1997). The Mars effect in retrospect. Skeptical Inquirer. Nov-Dec 1997, v21, n6, p24(6)
|


 AUTHOR: